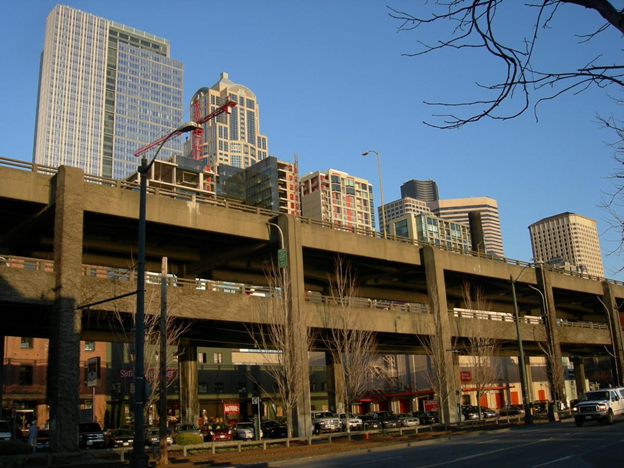
Remember the Viaduct? It closed permanently on January 11, 2019 initiating a full three-week closure of SR 99 downtown before the new SR 99 tunnel opened. At that time, approximately 250,000 people commuted to and from downtown each day. Along with our transportation agency partners, we did all that we could to get ready – from expanding transit service to monitoring our roads 24/7 to installing temporary bus-only lanes.
And we also asked travelers to prepare and change their habits to help reduce the number of cars traveling downtown and make space for transit. And the results? People drove less, took transit, and biked more. Our entire region came together to take on this challenge and be part of the solution. Read on for more results!
Driving (people drove less).
One of our goals during the 2019 SR 99 closure was to prevent gridlock by having fewer cars downtown. We can’t say it enough, Seattle, we couldn’t have done it without the collective whole working together.
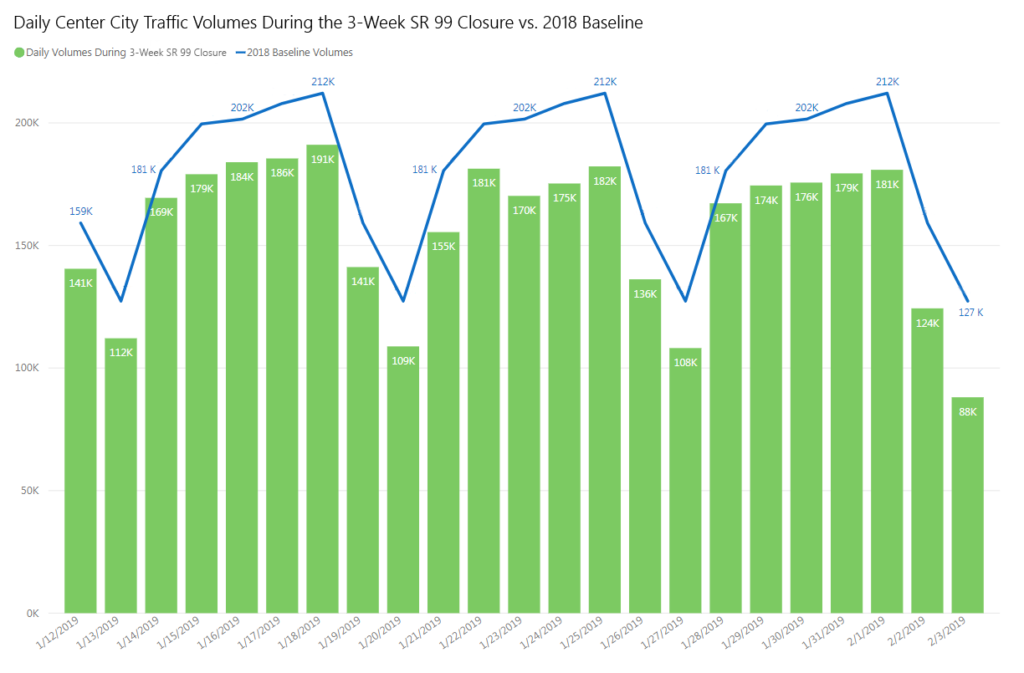
We were able to produce comparable data by counting vehicles that came into downtown Seattle from location points north (at Mercer St) and south (at Holgate St) into the center city and compared the numbers to a baseline period back in September 2018. For every single day that SR 99 was closed, fewer vehicles drove into downtown. See that blue line in the data graphic to the right? That’s the baseline volumes in 2018. The green was the daily volumes during the three-week SR 99 closure. You’re the best, Seattle.
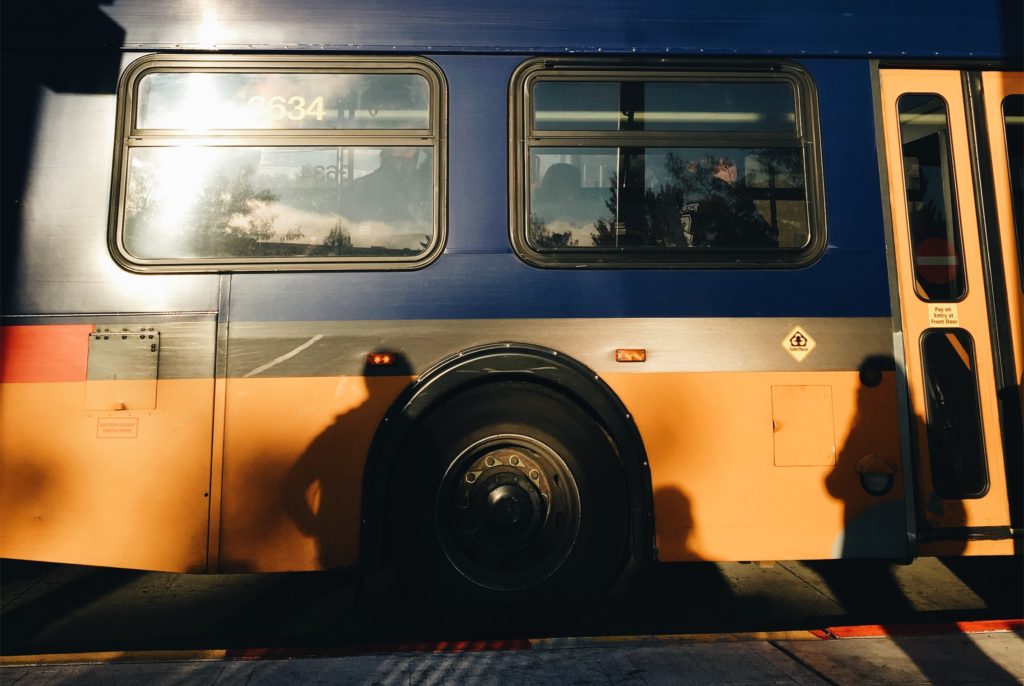
Transit (people took transit and shifted their commutes).
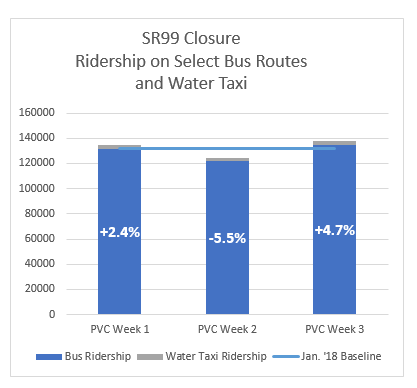
King County Metro tracked daily ridership along major corridors and on the water taxi. Bus and water taxi ridership varied during the closure, but ridership increased during two of the three weeks compared to January 2018. During each week of the closure, the percent of riders during the midday was higher as compared to the same month last year. That means there was a shift from commute times out of the peak/rush hours towards the midday.
Sound Transit’s Link light rail ridership during the three-week viaduct closure was up 14 percent from 2018, to more than 79,000 daily boardings.
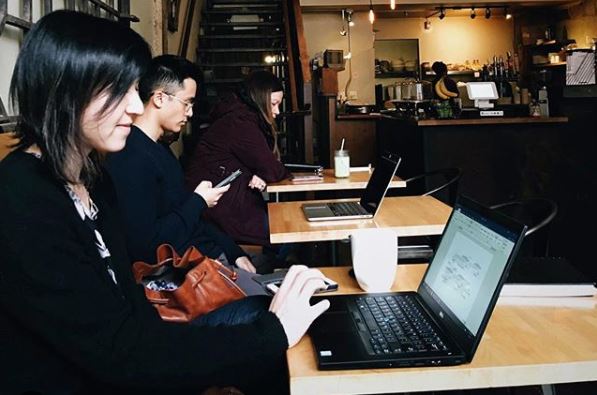
Telecommuting (people changed their work schedules).
According to a survey with some of the largest downtown employers, people used telecommuting as a great way to reduce commute trips downtown. We launched an Alternative Work Arrangement Pilot for Chapter 1 of the Seattle Squeeze. The City previously had 12.5 percent of employees that had alternative work arrangements, which included telework or flexible work hours. By January 11, 2019, 30 percent of Citywide employees were participating in alternative work arrangements, with 38 percent in the downtown core.
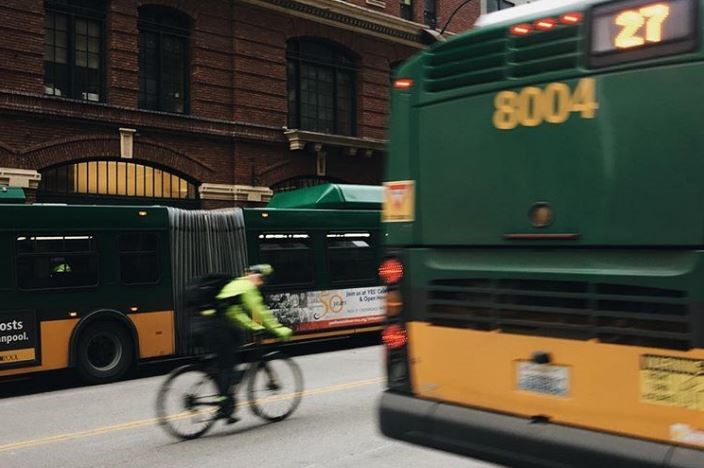
Biking (people biked more).
The number of people biking to and through downtown increased during the SR 99 closure. We installed bike counters at the Spokane St. Bridge, the Fremont Bridge, the Elliot Bay Trail, and 2nd Ave downtown. We saw 40,000 more trips in January 2019 compared to the same time in 2018.
We also expanded our free-floating bike share program and made it permanent. Our data shows that change paid off; we saw a significant increase in people who used free-floating bike share. Peek at the bike share data!